The Basics
Learning SignalFx can be overwhelming. There is a multitude of ways to integrate it with your applications. Choice overload can quickly set in; I like to narrow in on a fundamental problem first to simplify learning. I want to monitor a PostgreSQL database so here we go.
Facts
- It’s an operational intelligence tool designed to observe your systems.
- Costs $15.00 per host per month or $180 per year with host-based pricing
- Up to 10 containers per host are monitored with a host-based plan.
- There are many alternative operational intelligence tools on the market.
- It has a host of integrations with cloud technologies and traditional servers.
- SignalFx provides a free trial
Metrics and Metadata
The SignalFx agent collects metrics and sends them to their servers—the metrics consist of the following metric types.
Counters
Counters are a straightforward metric that only takes integer values, and they count things like the number of errors that have occurred.
Cumulative Counters
Cumulative counters last for the lifetime of a process or an application. The number of database calls since PostgreSQL started would be a cumulative counter.
Gauges
Gauges measure values over time, and the percentage of memory usage on a PostgreSQL server is an example of a gauge. The database memory fluctuates, and the gauge metric captures that fluctuation over time.
Metadata
Use metadata to filter, find, and aggregate the metrics you want to chart or alert on. An example would be an environment key-value pair.
environment:prod
The environment metadata will allow you to search by the environment within SignalFx.
Charts
Charts provide visualization of the metrics you send to SignalFx. A chart that shows the percentage of memory helps you decide when to upgrade said memory.
Dashboards
Dashboards allow you to group charts to get the big picture, and we can group them within dashboard groups. We can’t learn SignalFx without talking about dashboards.
- Built-In - Used to provide default dashboards for integrations like PostgreSQL
- Custom - Any custom dashboards you create
- User - Primarily used for isolated experimentation and visualization
Detectors and Alerts
Detectors consist of events, alerts, and notifications. They can trigger alerts and notifications based on conditions. It’s possible to chain detectors by triggering additional events and notifications after a detector fires an event.
The Container
I’ve chosen to instrument a Postgresql server. These are technologies I’m comfortable with and can get up and running quickly, and using familiar technologies will allow me to learn SignalFx more effectively.
I’ve created a container that installs the Postgresql server and the SignalFx collectd per the advanced installation options.
I configured the agent.yml with these options from the Postgres monitor documentation.
Grab your Organization’s access token.
Profile -> Organization Settings -> Access Tokens
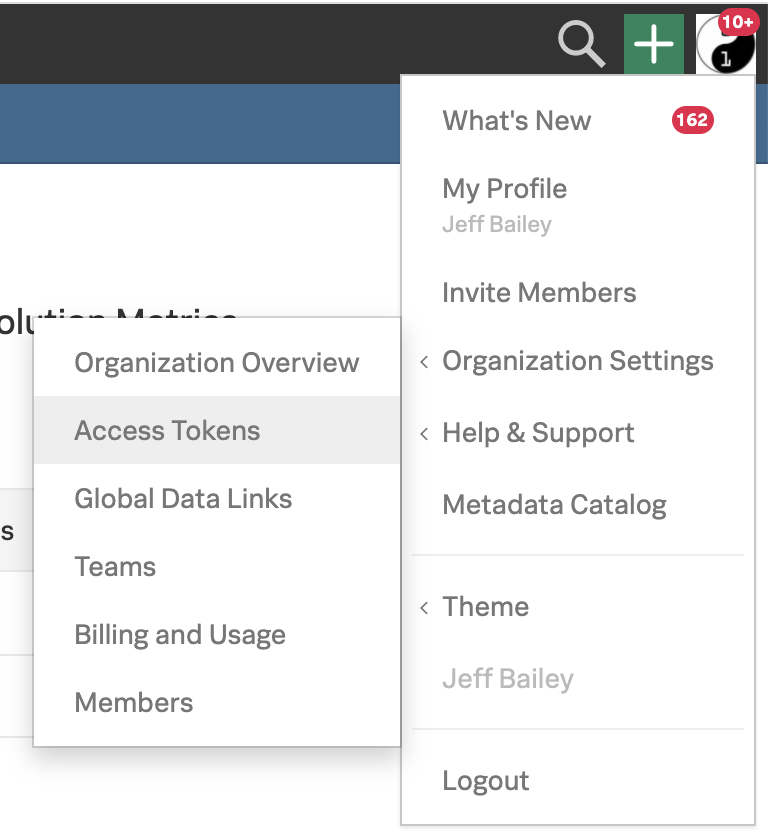
I chose to store the SignalFx access token in a file. See the SignalFx remote configuration documentation for configuration options and the agent.yml for more context.
The Dashboards
Every host has its dashboard by default. Now that the agent is running, we can open Signal FX and choose the INFRASTRUCTURE menu item.
We’ll find our host running after data makes its way to the SFX API.
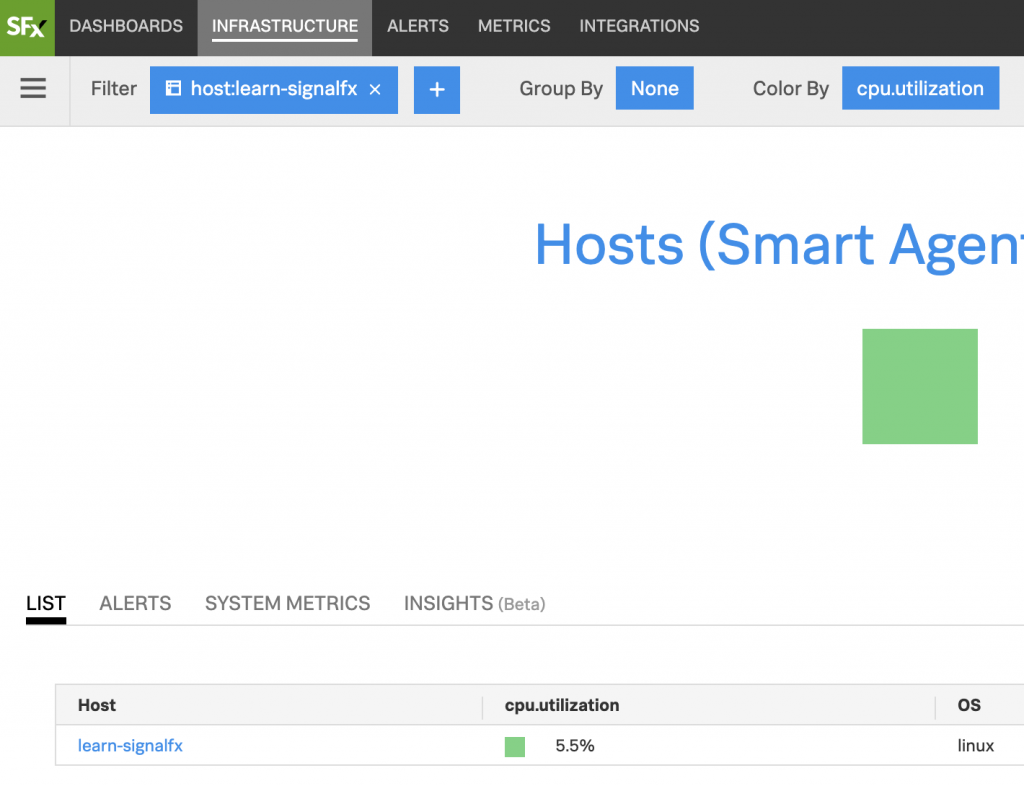
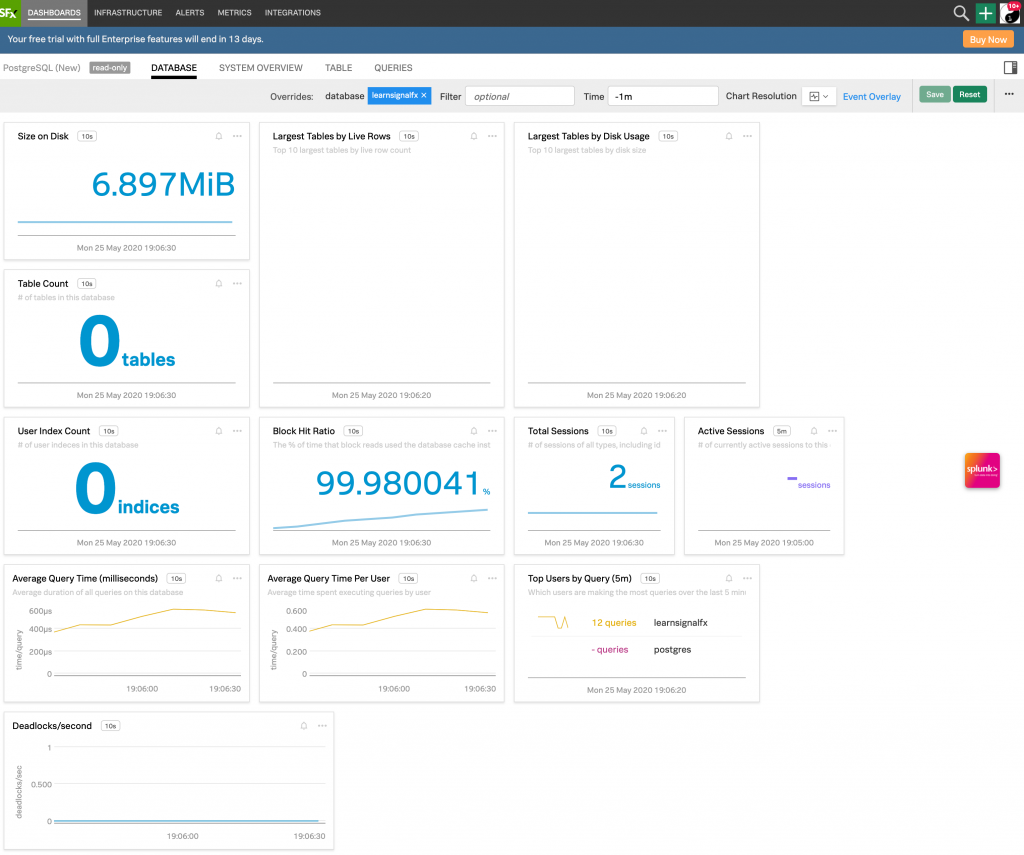
In addition to the host’s dashboard, SignalFx provides a PostgreSQL dashboard. The dashboard offers a view of database-level resources out of the box.
Poking with Sticks
I connected to the container in another terminal with this command.

docker exec -it learning-signalfx /bin/bash
I ran these commands to do a read-only benchmark test.
pgbench -i learnsignalfx
pgbench -c 4 -j 2 -T 600 -S learnsignalfx
The event predictably created a spike in CPU, as evidenced by the default APM dashboard.
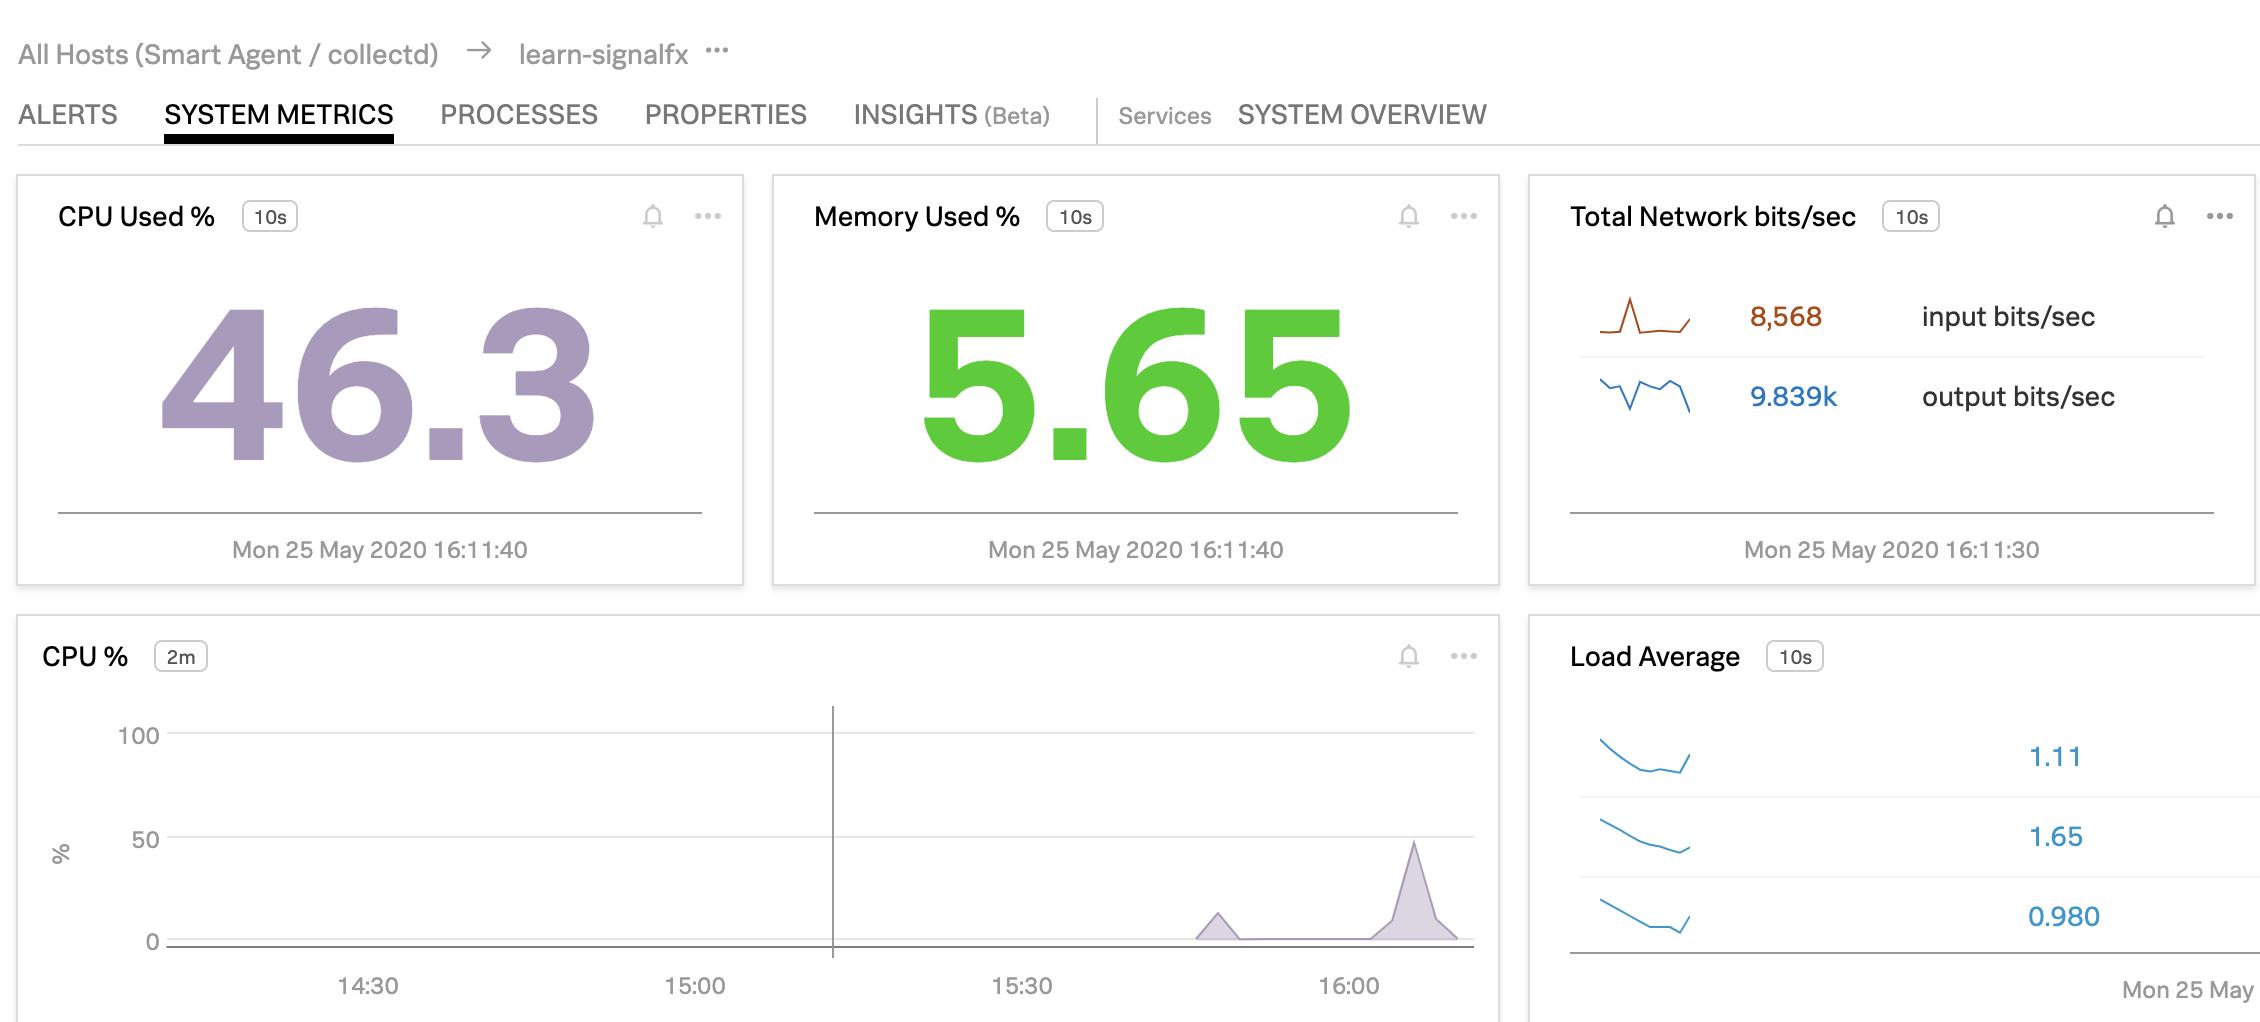
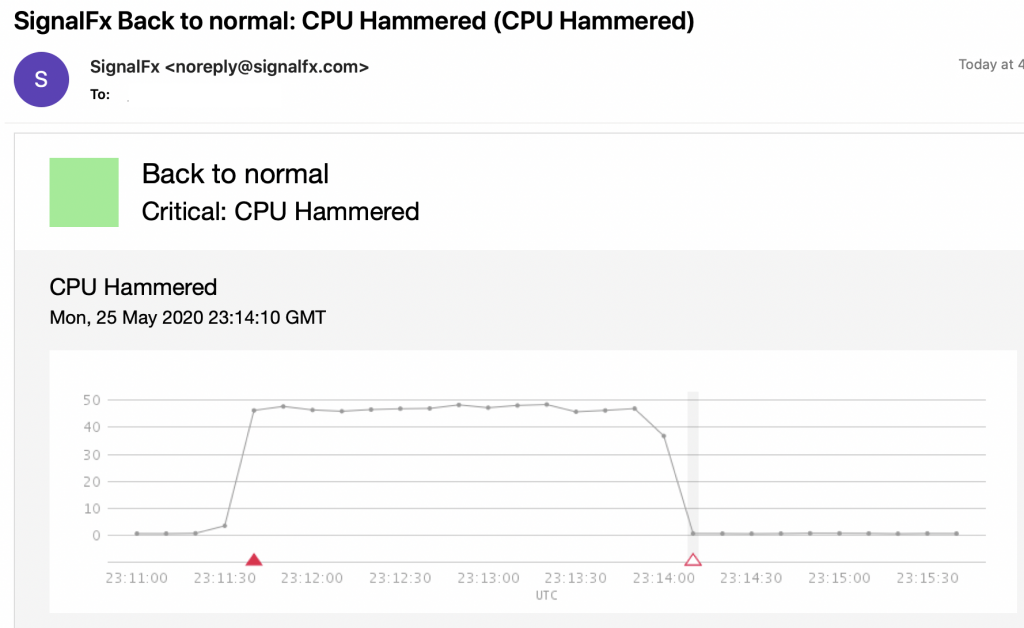
I created a detector for CPU utilization. I then reran the benchmark, and sure enough, an alert fired.
I then stopped the benchmark. Shortly after that, I received another email letting me know everything was back to normal.
There are other fun benchmark tests you can run with the pgbench command. Enjoy trying interesting detectors, charts, and dashboards on your own.
Learn SignalFx - Beyond the Basics
It appears that books are scarce for SignalFx. These resources will help with learning more about SignalFx.
- Signal FX - Key Documentation
- Study Material
